


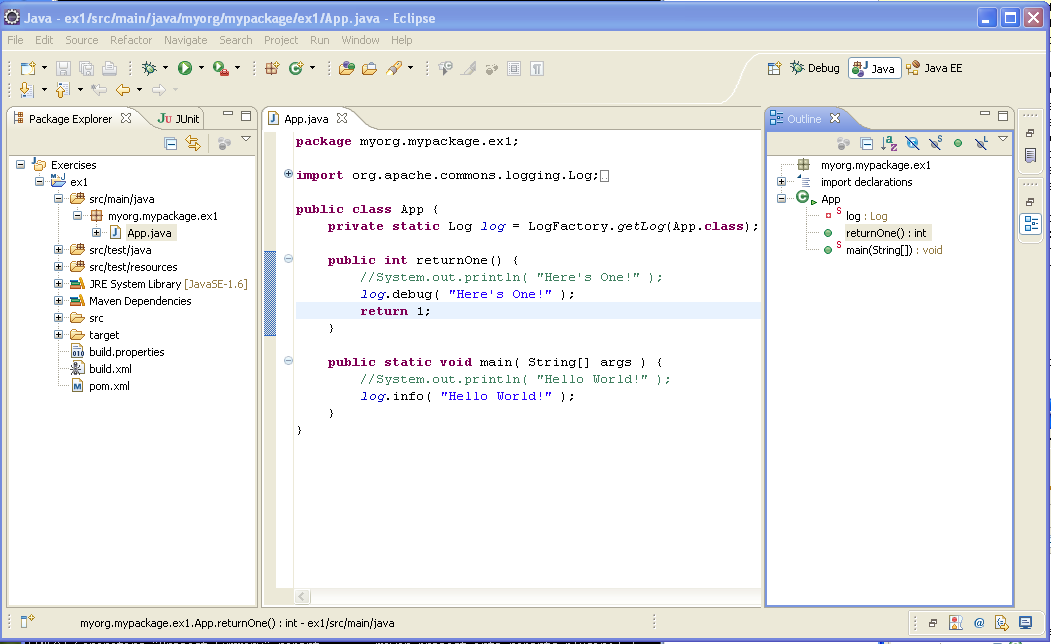
We will be using m2e and you will import your projects as Maven Projects and access goals through the "Run..." button.
        <dependency>
            <groupId>junit</groupId>
            <artifactId>junit</artifactId>
            <version>3.8.1</version>
            <scope>test</scope>
        </dependency>
<dependency>
<groupId>junit</groupId>
<artifactId>junit</artifactId>
<version>4.10</version>
<scope>test</scope>
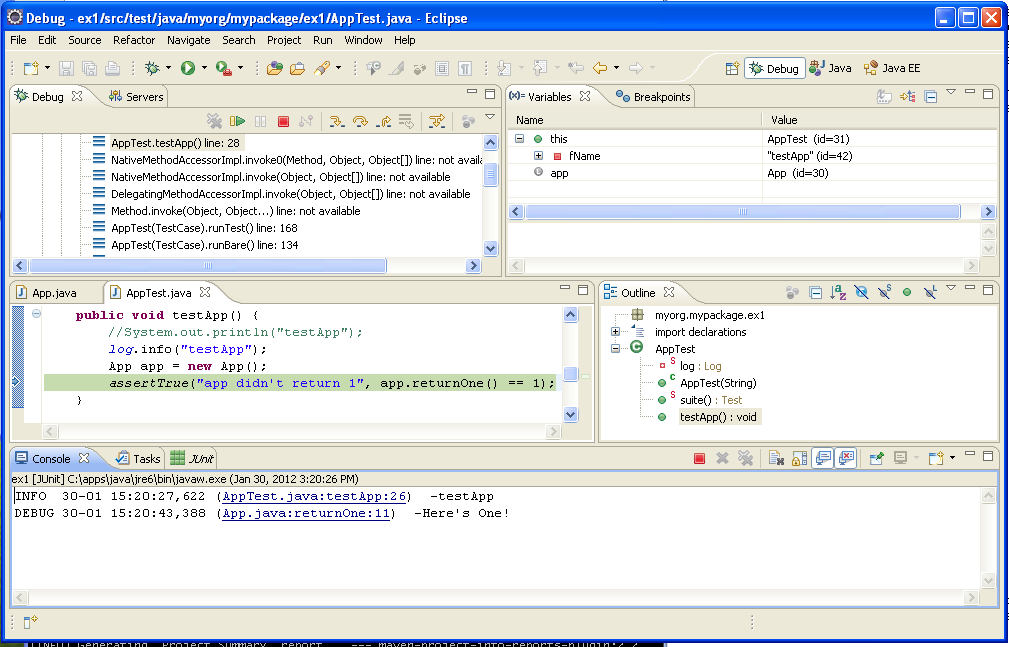
</dependency>I will first show you how to run the debugger running under a normal Maven build. When doing this, you need to realize that there will be 2 processes; the "remote" application being launched/tested and the "local" debugger that is commanding the remote JVM through its actions.
<settings xmlns="http://maven.apache.org/POM/4.0.0"
    xmlns:xsi="http://www.w3.org/2001/XMLSchema-instance"
    xsi:schemaLocation="http://maven.apache.org/POM/4.0.0 http://maven.apache.org/xsd/settings-1.0.0.xsd">

...

    <profiles>
        <profile>
            <id>debugger</id>
            <activation>
                <property>
                    <name>debugger</name>
                </property>
            </activation>
            <properties>
                <surefire.argLine>-Xrunjdwp:transport=dt_socket,server=y,suspend=y,address=8000 -Xnoagent -Djava.compiler=NONE</surefire.argLine>
            </properties>
        </profile>
</profiles><?xml version="1.0"?>
<project xmlns="http://maven.apache.org/POM/4.0.0"
xmlns:xsi="http://www.w3.org/2001/XMLSchema-instance"
xsi:schemaLocation="http://maven.apache.org/POM/4.0.0 http://maven.apache.org/maven-v4_0_0.xsd">
...
<build>
<plugins>
<plugin>
<groupId>org.apache.maven.plugins</groupId>
<artifactId>maven-surefire-plugin</artifactId>
<configuration>
<argLine>${surefire.argLine}</argLine>
</configuration>
</plugin>
</plugins>
</build>
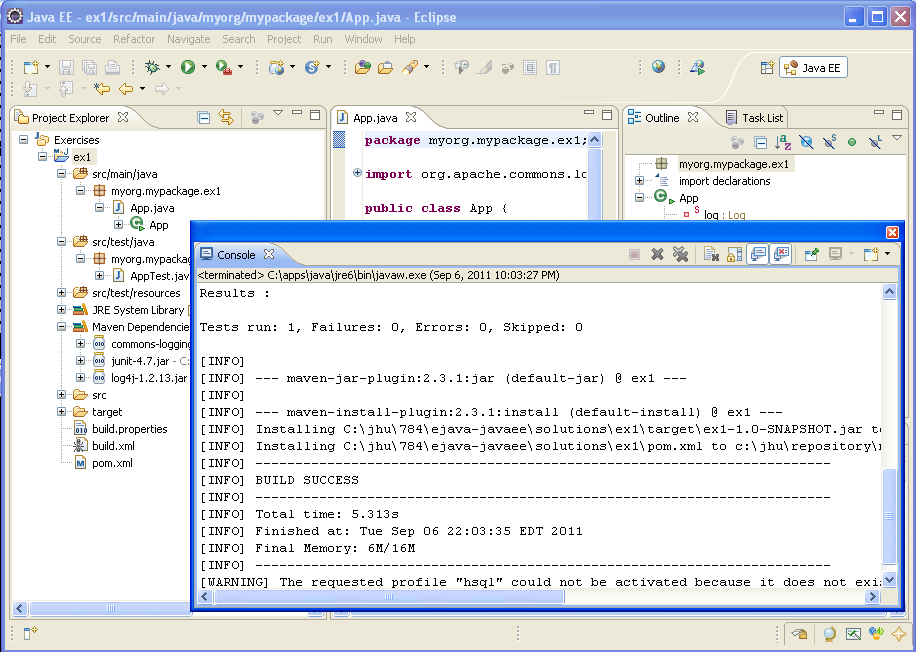
</project>$ mvn test -Pdebugger [INFO] Scanning for projects... [INFO] ----------------------------------------------------------------- [INFO] Building My First Simple Project [INFO] task-segment: [test] [INFO] ----------------------------------------------------------------- ... [INFO] Nothing to compile - all classes are up to date [INFO] [surefire:test] [INFO] Surefire report directory: c:\jhu\784\ex1\target\surefire-reports Listening for transport dt_socket at address: 8000
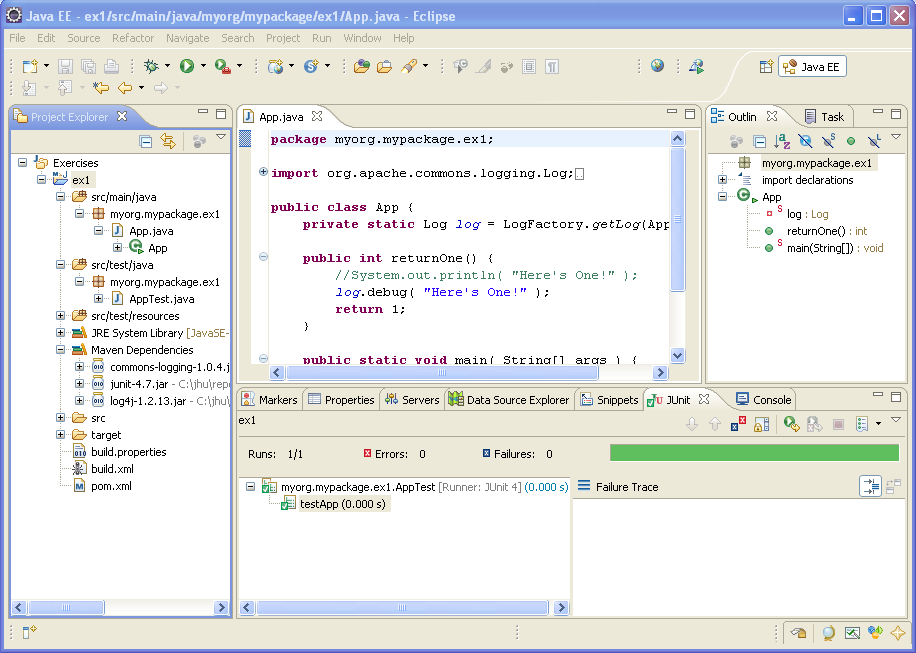
In this part of the exercise, you were able to integrate your Maven and Eclipse environments. This allows you to leverage the Maven plugins as your core build system and leverage Eclipse for creating Java files and providin.
As mentioned, Eclipse will be the primary demonstration environment in class, but you may use other IDEs, like NetBeans, to match personal preferences.